

Infographics and data visualizations are shifting the way people find and experience stories, creating a new way of seeing the world of data. They help communicate complex ideas in a clear, compact and beautiful way, taking deep data and presenting it in visual shorthand. In short we can say a infographic is basically a large visual image, which presents data in a meaning full flow. You can learn and understand more from a infographic within minutes compared to reading about it.
In Visual.ly they collect the best examples of Infographics on the web and gathered them for reference, share, and enjoy.
Visual.ly Features
- Infographics are arranged in several categories for easy lookup.
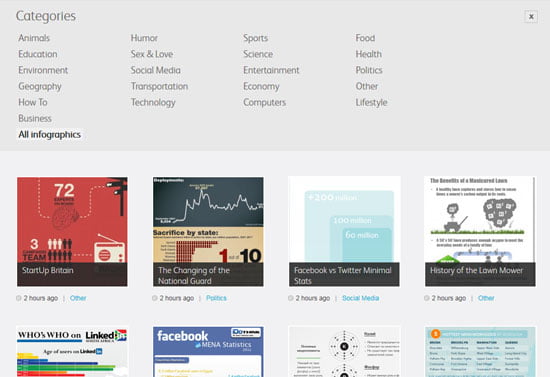
- Every infographics shows the author and where on the web it was published.
- If you have created any infographics you can register on Visual.ly and publish your work, it will drive lots more users to see your work
- Also Visual.ly is now working on a lab feature, which allows users to create infographics from there data. Currently it has a Twitter Visualizer which generates a personalized infographic of your Twitter persona based on what you tweet. ( Visual.ly lab )
It seems to be a very interesting site to collect, share and learn Infographics. Do comment your views on it.
Links : Visual.ly